
Introduction
Qualitative research can generate extraordinary amounts of data. Because it’s generally exploratory, the findings often do not easily plug into a predefined analytical framework. Organizing and synthesizing the collected data to enable the identification of relevant and actionable insights can involve more time and effort than any other aspect of the project, including fieldwork. This is true of qualitative research in general, as well as specific methods.
One approach that can generate particularly robust data sets is the diary study. The project design will include specific questions and participant assignments that establish a structure for incoming data, but at the same time, the more forthcoming and unguarded respondents are in their feedback, the more unstructured data there will be. At the end of a diary study, researchers are often left with the question “How can I leverage all this rich data”.
Empathy mapping is a visualization tool often used when the objective is to gain a complete understanding of a particular type of user. Empathy maps are developed collaboratively to articulate what is known about an individual user or aggregation (segment) of users. It can work extremely well as a means of interpreting data from a diary study.
Diary Study Essentials
Diary studies capture longitudinal data, that is, experiences and activities occurring over an extended period of time. They are used to understand the context surrounding customer interactions with products, services, and brands. Diary study questions may include:
- What do typical – and not-so-typical – usage scenarios look like?
- What tasks are being performed? When, where, and under what conditions?
- What aspects of product interactions are routine based? What drives the routine and what prompts deviation from it?
- What do users feel and think when they are using a product?
- Where is their loyalty – or lack of loyalty – rooted or based?
- How do users navigate across different channels and devices to interact with a product, brand, or organization? How do they experience specific touchpoints and transitions from one to another?
Empathy Mapping Essentials
Empathy mapping draws on primary data to create a holistic portrait of a user or segment of users, articulated in terms of what they say, think, do, and feel. It’s an immersive process that helps a research team achieve a more authentic understanding of the customer’s world and their needs. It effectively shifts the focus from the product, service, or brand to the people who engage with it.
The Empathy Mapping Process
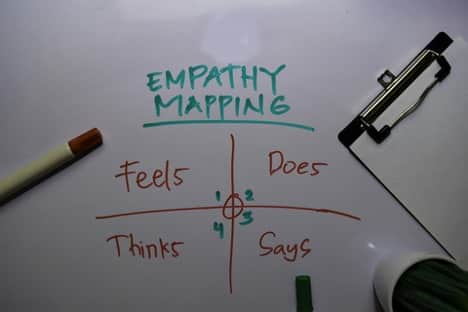
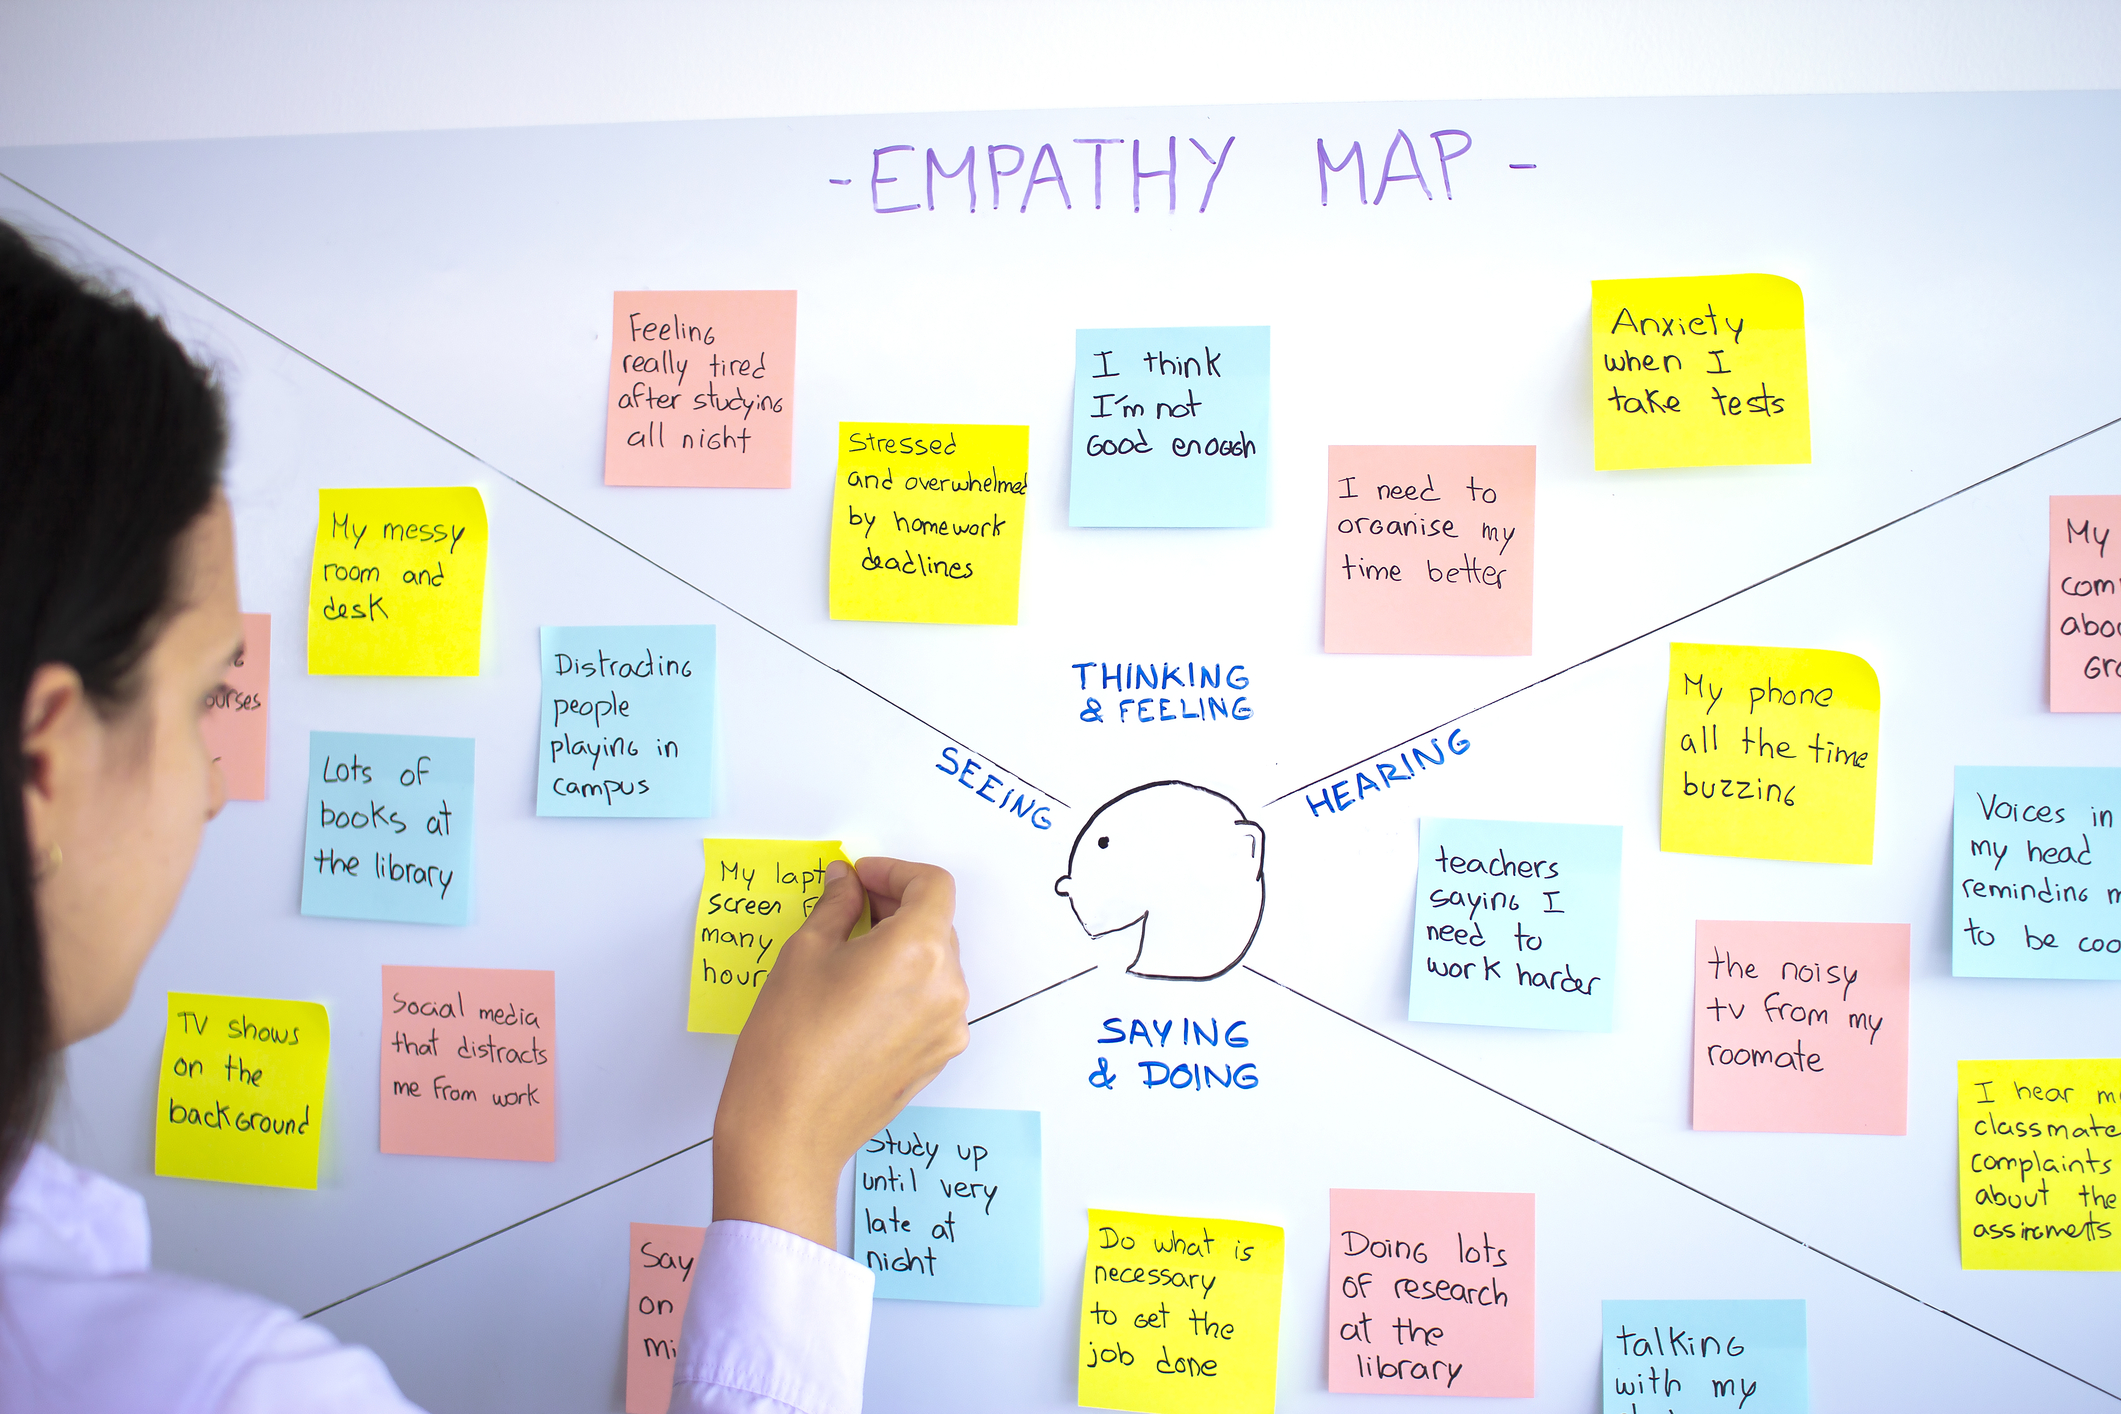
Empathy mapping can be done as a solo exercise but is most powerful when practiced as a collaboration. Either way, the protocol is the same. Begin with the empathy map template: the user in the center of four quadrants labeled: says, thinks, does, and feels.
Using sticky notes and markers (or the digital equivalents depending on session facilities and logistics), draw on the research findings to fill in the quadrants.
- Says: What does the user say out loud? What explicit comments, statements, and answers have they provided?
- Thinks: This will likely mirror the “says” quadrant but it also is where we pin down what is not being said aloud, or in so many words.
- Does: What actions does the user take?
- Feels: How do they feel about the user experience? What annoys them? Excites them? Puzzles them?
Approach empathy mapping as more of an interpretive, than an analytical exercise. That will help you make room for inconsistencies and ambiguities which, it turns out, can be the most valuable for understanding users. Precision is not especially important or useful here. Look for themes across quadrants but also find and register the outliers. The goal is to detect and recognize everything respondents have offered, whether stated explicitly or telegraphed through actions and implications. The quadrants help ensure you are getting the whole picture. If one is empty, then additional research is needed.
Empathy maps are an effective tool for bringing order to qualitative research findings, distilling relevant insights, and identifying knowledge gaps. The resulting visual outputs are easily digestible and become powerful tools for sharing what has been learned and what remains to be understood. Recognized and treated as a source of truth, they can help prevent bias and unfounded assumptions from creeping into a project.
Empathy Mapping Guidelines
Always begin by defining the goals and the scope of your empathy mapping project. Are you analyzing a transcript? Finding alignment within the team about a user or a segment? Using the empathy map as a first step in developing a persona? (Note: An empathy map can be used to understand an aggregation of users but is never a substitute for a persona.)
For a conventional setting, these will include a whiteboard, markers, and sticky notes. These days a group might convene virtually and use digital tools like miro of Figma. If you’re heading into the empathy map process on your own, then use a whiteboard if you have access to one, or find a template online that works for you.
Collect the research findings from which the empathy map will draw, and distribute them. Have everyone on the team review the data and then independently generate notes for each quadrant. Each team member should offer at least one note to every quadrant. After registering impressions independently, each person discusses their contributions and elaborates on what they think it means. The ensuing discussion helps synthesize and align team members, culminating in a shared understanding of the user in all their ambiguous, inconsistent, real-life glory.
Empathy Mapping with Diary Studies
By now it should be clear how diary studies and empathy mapping can complement each other.
Well-conducted diary studies generate a wealth of rich information about users’ real lives. Remote diary studies that leverage mobile devices to collect data in the form of pictures, video, and text are a treasure trove that research teams can utilize to build empathy maps.
Empathy mapping offers a way to sort a mountain of data into a coherent portrait of a user (or segment of users), achieving as much or as little granularity as needed. At the same time, you identify any knowledge gaps that need to be addressed through further research; and establish a shared understanding that can be proof against “slippage” from assumptions or bias.
Empathy mapping with diary studies is a strong methodological pairing when your focus is new product design, fleshing out a customer journey map, or tackling any topic that involves understanding user experiences in the context of their everyday lives